
Marketing KPI Definitions
How Data Governance Improves Marketing Reports
- AI Business Use Case
Three dashboards, three numbers for the same campaign. The cause usually sits upstream of the reporting tool, in a missing marketing KPI definition, an unnamed owner, and an undeclared source of truth. Here is what data governance changes across the marketing reporting chain, and what it does to the figures your board sees.
The quarterly review that costs marketing its budget
Picture the quarterly review. Marketing brings a lead figure from the automation platform. Sales brings a lower one from the CRM. Finance has a third number in the board pack, built from invoiced revenue. The next twenty minutes go on reconciling three numbers, and the campaign discussion never happens.
The pattern is measurable. In a TransUnion and EMARKETER survey of nearly 200 senior marketing leaders, more than 60% said stakeholders had questioned their metrics, and 28.5% said their budgets faced potential cuts because those metrics were in doubt. Confidence in measurement accuracy stayed flat for 54.1% of respondents over the year, and 14.3% said it had declined.
Reporting credibility carries a price tag, and marketing pays it at budget time.
Why one metric produces three numbers
Three mechanisms explain almost every mismatch that shows up in marketing reporting.
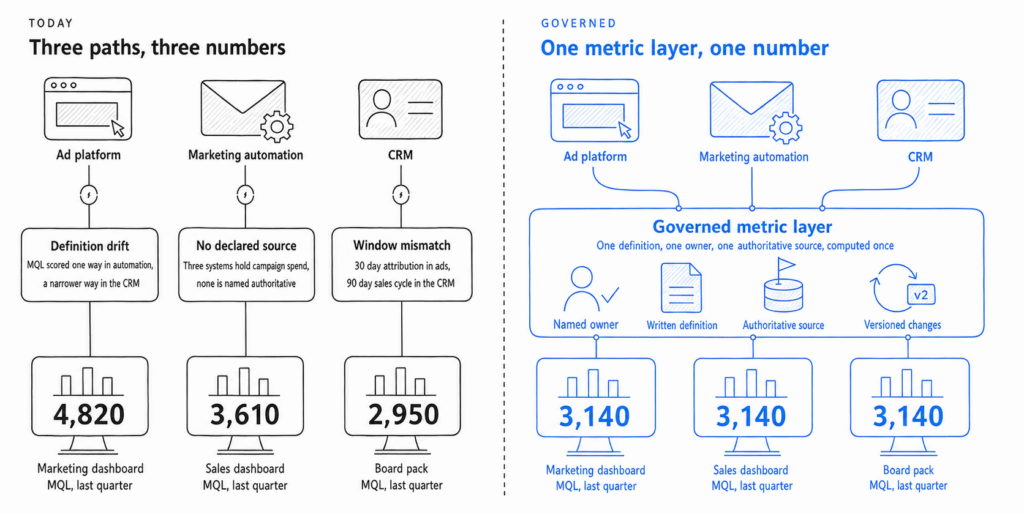
- Definition drift. Marketing qualified lead means one thing in the automation platform and something narrower in the CRM. Active customer, session, conversion, and pipeline contribution carry the same problem. Each system ships with a default definition, and each team quietly adopts the one in front of it.
- Undeclared source of truth. Ask which system holds the authoritative campaign spend figure and the room usually pauses. Where no system has been declared authoritative, every report becomes a negotiation.
- Mismatched time and attribution windows. One report counts on click date, a second on conversion date, a third on invoice date. A 30-day attribution window in the ad platform meets a 90-day sales cycle in the CRM. Those two numbers were never going to agree.
Adverity’s 2025 study of CMOs across the United States, the United Kingdom, Germany, Austria and Switzerland puts a scale on this: 45% of the data marketers use for business decisions is incomplete, inaccurate or out of date, and 43% of CMOs believe less than half of their marketing data can be trusted. Asked where progress is most needed, CMOs named completeness (31%), consistency (26%) and uniqueness (16%). The TransUnion respondents pointed the same way, with 49.5% citing siloed and incomplete data and 48% citing cross-channel deduplication problems.
What data governance changes in marketing reporting
Data governance is a set of decisions about ownership, definitions, rules and access. The groundwork is covered in our earlier article, What Is Data Governance?, and applied to the marketing reporting chain, it comes down to four commitments.
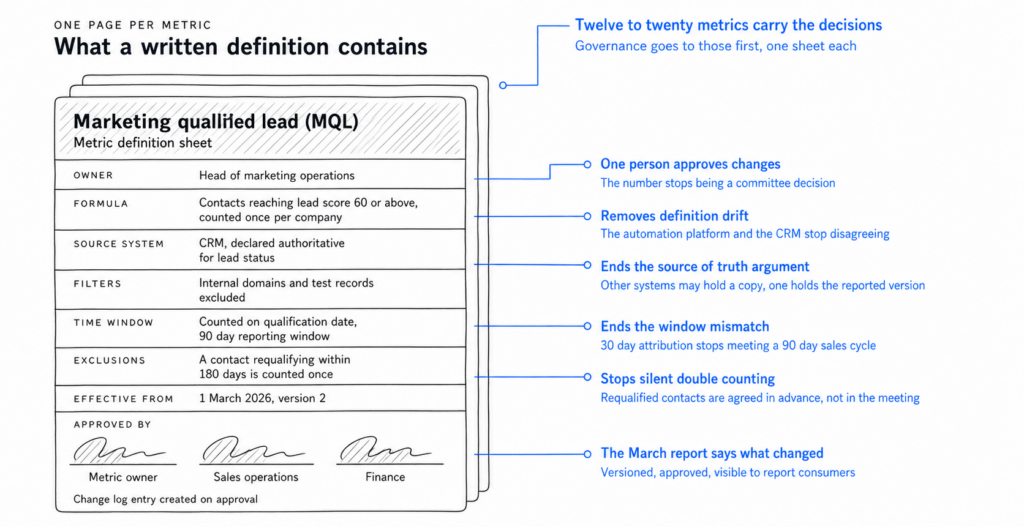
- Every metric in a management report has a named owner. One person decides what the number means and approves changes to it.
- The definition lives in one written place. Formula, source system, filters, time window, exclusions, and the date the definition took effect.
- One system is declared authoritative for each figure. Other systems may hold a copy. One holds the version that goes into reporting.
- Changes follow an approval path and get versioned. When the definition of a qualified lead changes in March, the March report says so.
Four commitments look modest on paper. They remove most of the argument from the quarterly review.
Gartner predicts that 80% of data and analytics governance initiatives will fail by 2027, and the reason given is worth repeating: the absence of a real or manufactured crisis. Governance run as a hygiene project loses its sponsor by month three. Marketing reporting makes an unusually good starting point for that exact reason. The crisis is already on the calendar; it recurs every month, and everyone in the room can feel it.
The use case, step by step
Here is how the work runs in practice.
- Draw the reporting chain. We sit down with the marketing, sales, and IT people and draw the real path of each reported figure on one shared diagram: which platform creates it, which pipeline moves it, which transformation touches it, which dashboard displays it. Across fifteen-plus years of enterprise integration work, this step keeps producing the same surprise. The break sits somewhere the team had marked as safe.
- Inventory the metrics that carry decisions. Marketing teams typically report dozens of figures. Twelve to twenty of them drive the decisions. Governance goes to those first.
- Write the definition sheet.One page per metric, precise enough that a new analyst can implement it without asking anyone.
- Declare the authoritative source per metric. Spend from the ad platform, lead status from the CRM, revenue from the ERP. Write it down, including the reconciliation rule for the cases where two sources disagree.
- Build the metric layer once. The agreed logic gets implemented in one governed dataset or semantic layer that every dashboard reads from. Three dashboards then show one number, because the number is computed once.
- Add quality checks and change control. Freshness, completeness, and duplicate rates are monitored automatically. An approval path for definition changes, and a changelog that report consumers can see.
- Publish the glossary. A definition nobody can find gets reinvented within a quarter.
A KPI glossary only creates value if employees can actually find and use it. See how governed knowledge becomes accessible in AI Search: Turning Organizational Knowledge into Confident Decisions →
What changes in the numbers
Three effects show up consistently once the metric layer is in place. Reconciliation time drops, because there is nothing left to reconcile. The reporting cycle closes earlier, because assembly stops being manual. And the numbers survive questioning, because their provenance is written down. That third effect is the one that protects budget. Adverity’s CMOs ranked improving data quality (30%) as the single biggest lever for marketing performance, ahead of automating data workflows (22%) and improving data democratization (21%). Gartner’s widely cited estimate puts the average annual cost of poor data quality at USD 12.9 million per organization. Marketing carries a visible share of that figure, and it carries it in public.Where to start on Monday
Take the one metric that caused an argument in the last quarter. Write its definition on a single page: formula, source, filters, window, exclusions. Name its owner. Get the owner and the two people who dispute the number to sign off on that page. Then take the second metric.
A written definition for one contested number buys back reporting credibility at a very low cost, and it tells you quickly how deep the rest of the problem goes.
Ask this at your next marketing meeting: which system is the authoritative source for the lead figure in your last board pack, and who is allowed to change how it is calculated? If the room needs more than a minute, you have found your starting point.
Clear metric definitions are one example of a broader principle: employees work more consistently when enterprise systems are easy to understand and use. We explore that connection in Why Employees Quietly Work Around Your Software →
Where do your marketing reports stand today?
If the figures in your marketing reports live in several systems, need manual assembly, or produce a different answer depending on who runs them, a structured assessment is the sensible first step. The Omnit Data Assessment takes two to three weeks, runs on two to three workshops with your own team, and closes with an executive summary of eight to twelve pages: where the breaks in your data sit, what they cost you, and which three steps are worth taking first. Price from EUR 1,450 plus VAT.
Sources
- Adverity. (2025, September 2). Fixing the Foundation: The State of Marketing Data Quality 2025. Press release summarizing a survey of CMOs in the United States, the United Kingdom, Germany, Austria, and Switzerland. Source of the 45%, 43%, 31%, 30%, 26%, 22%, 21%, and 16% figures. Read article →
- EMARKETER & TransUnion. (2025, October 22). Emergency Rehab: Why Rebuilding Trust in Marketing Measurement Matters. Survey summary based on responses from nearly 200 senior marketing leaders. Source of the 60%, 54.1%, 49.5%, 48%, 28.5%, and 14.3% figures. Read article →
- Gartner. (2024, February 28). Gartner Predicts 80% of D&A Governance Initiatives Will Fail by 2027. Gartner press release. Source of the forecast that 80% of data and analytics governance initiatives will fail by 2027 and the explanation for that prediction. Read article →
- Gartner. (2020). Magic Quadrant for Data Quality Solutions. Gartner research summarized on Gartner’s Data Quality topic page. Source of the widely cited estimate that poor data quality costs organizations an average of USD 12.9 million per year. Read article →

Csaba Fekszi
Csaba Fekszi is an IT expert with more than two decades of experience in data engineering, system architecture, and AI-driven process optimization. His work focuses on designing scalable solutions that deliver measurable business value.
Related posts




The 70% Below the Surface That Most Quotes Never Show

The real barriers to enterprise AI, and what the companies that succeed do differently
Are you sure AI is the right next step?
We help uncover the real opportunities, limitations, and realistic next steps.